Power BI Analytics Dashboards
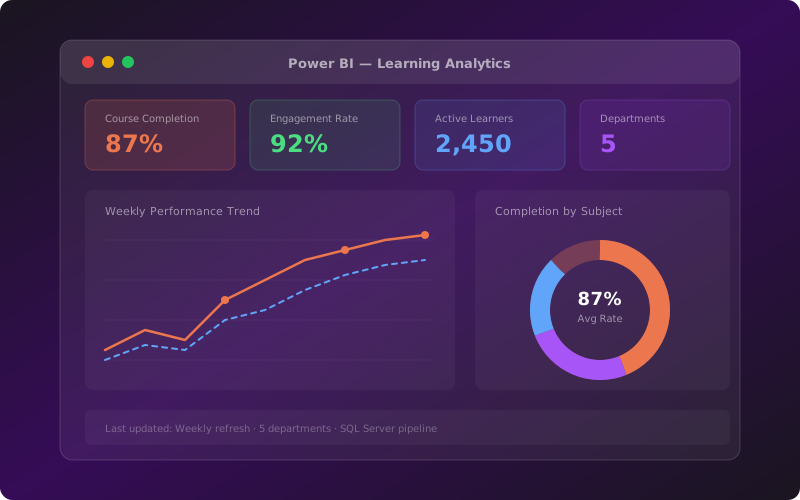
Developed Power BI dashboards tracking course completion, engagement, and performance metrics used weekly by leadership teams. Wrote SQL queries to extract and transform data from production databases, reducing data errors by 15% through validation processes.
Problem
Leadership and operations teams at an EdTech company had no centralised view of learning performance. Course completion rates, student engagement, and content effectiveness were buried in raw database tables and disconnected spreadsheets. Weekly reporting took hours of manual extraction, formatting, and emailing — and the data was often stale or inconsistent by the time it reached decision-makers.
Solution
Built a suite of interactive Power BI dashboards providing weekly, self-service insights into course completion, engagement metrics, and performance trends. Automated the data pipeline from SQL Server extraction through to visual reporting, replacing manual spreadsheet workflows with reliable, refresh-on-demand dashboards used by five departments.
Tech & Decisions
Power BI was chosen for its native integration with SQL Server and its ability to deliver interactive, self-service visualisations to non-technical stakeholders. SQL Server provided the production data source with complex relational queries needed to join course, user, and engagement tables. DAX measures enabled calculated KPIs like rolling averages and completion rates that updated dynamically. Excel was retained for edge-case data preparation where pivot tables were more practical than SQL transforms.
My Role & Actions
Wrote an average of 10–15 SQL queries per reporting cycle to extract and transform data from production databases. Designed the data model in Power BI connecting multiple fact and dimension tables. Built DAX measures for key metrics including completion rates, engagement scores, and trend analysis. Automated spreadsheet formatting and import workflows using Excel formulas and pivot tables, reducing processing time by 20%. Trained and supported over 40 staff members on data tools, improving company-wide data literacy and adoption.
Results & Impact
Enabled 60% faster decision-making by replacing manual reporting with self-service dashboards. Reduced reporting data errors by 15% through improved data cleaning, validation, and preparation. Empowered 5 departments with weekly insights. Supported data training for 40+ staff members. Cut spreadsheet processing time by 20% through automation.
Key Highlights
- Built dashboards used weekly by leadership teams
- Wrote 10–15 SQL queries per reporting cycle
- Trained 40+ staff members on data tools
- Automated spreadsheet formatting workflows
- Delivered insights across product, customer success, and operations